《結晶粒度分析軟件》(GAEA WinSieve)v1.20/含破解文件[壓縮包] 簡介: 中文名 : 結晶粒度分析軟件 英文名 : GAEA WinSieve 資源格式 : 壓縮包 版本 : v1.20/含破解文件 發行時間 : 2011年 制作發行 : GAEA Technologies Ltd. 地區 : 美國 語言 : 英文 簡介 : Just unpack&install. Unrar crack.rar to installdir. 軟件類
"《結晶粒度分析軟件》(GAEA WinSieve)v1.20/含破解文件[壓縮包]"介紹
中文名: 結晶粒度分析軟件
英文名: GAEA WinSieve
資源格式: 壓縮包
版本: v1.20/含破解文件
發行時間: 2011年
制作發行: GAEA Technologies Ltd.
地區: 美國
語言: 英文
簡介:
軟件性質:破解軟件
操作系統:Windows
應用平台:Windows 2000 and XP.
問題反饋: http://www.gaea.ca/en-us/dept_3.html
網站鏈接: http://www.gaea.ca/en-us/dept_3.html
軟件介紹:
能夠快速輸入和打印結晶粒度分析曲線,支持很多種標准格式,也可以自定義格式。每個結晶粒度分析可以包括過濾數據和液體比重計數據等。
WinSieve
Now Compatible with Windows 7
The newest version (1.18) of WinSieve is now compatible with Windows 7. In addition, the sieve results can now show mean, sorting, skewness, and kurtosis.
WinSieve can be used to enter, edit and print grain size analysis charts in several standard or custom formats.
Would you like to learn more about our software, but do not have the time to download and try-out the demo? You can watch a movie of the demo on your computer instead by clicking below.
Grain size analysis tests can include sieve data, washed sieve data, and hydrometer data as specified in ASTM Test Method D-422. There is no limit to the number of samples in a project and the number of tests per sample.
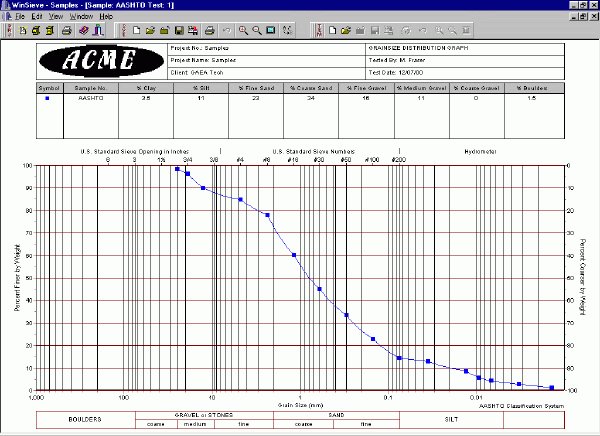
Each grain size analysis chart is composed of three parts; a graph, an optional legend, and a header. The graphical windows interface displays the charts as they are entered and shows how the chart will look when it is printed.
All test results, sample and project information is stored in a Microsoft Access relational database. This database allows for the quick storage and retrieval of sample and test data, and can be interfaced with a variety of other programs. There is no limit to the number of projects, samples, and test results that can be stored in the database. The database is setup to work across a network if desired, with each project stored in a separate directory.
A master project database is maintained by the program to track the status and locations of projects. This database contains the project number, name, and directory location.
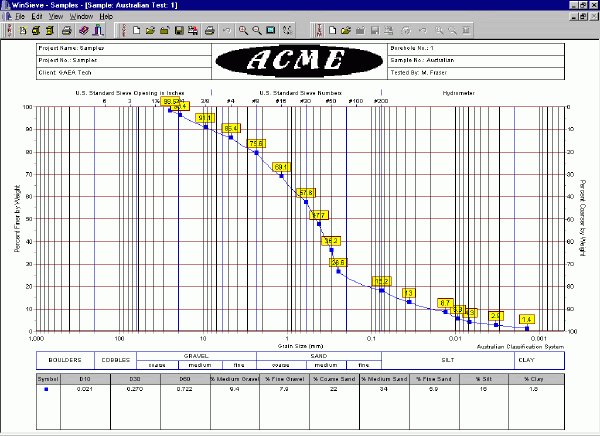
Grain size analysis results for up to 5 tests can be plotted on a single graph. In addition, the grain size specifications can also be plotted on the graph. Classification system, fonts, colors, scales, line types, point types, and titles can be easily customized for each graph.
The classification system is plotted beneath each graph to provide easy comparison with sample results. Several standard classification systems are provided including:
The sieve analysis can also have an optional legend block at the top or bottom, which can be used to display sample information, classification results, and grain size analysis results. A header is also displayed at the top or bottom of each graph, which can be used to show a company logo or site map (stored as a bitmap and imported into the program), project name and number, borehole information, sample information, or other text.
代碼
★未經過安全檢測
[安裝測試]
★未經過安裝測試,使用者後果自負與本論壇無關。
英文名: GAEA WinSieve
資源格式: 壓縮包
版本: v1.20/含破解文件
發行時間: 2011年
制作發行: GAEA Technologies Ltd.
地區: 美國
語言: 英文
簡介:
軟件類型:軟件>應用軟件
Just unpack&install. Unrar crack.rar to installdir.
軟件性質:破解軟件
操作系統:Windows
應用平台:Windows 2000 and XP.
問題反饋: http://www.gaea.ca/en-us/dept_3.html
網站鏈接: http://www.gaea.ca/en-us/dept_3.html
軟件介紹:
能夠快速輸入和打印結晶粒度分析曲線,支持很多種標准格式,也可以自定義格式。每個結晶粒度分析可以包括過濾數據和液體比重計數據等。
WinSieve
Now Compatible with Windows 7
The newest version (1.18) of WinSieve is now compatible with Windows 7. In addition, the sieve results can now show mean, sorting, skewness, and kurtosis.
WinSieve can be used to enter, edit and print grain size analysis charts in several standard or custom formats.
Would you like to learn more about our software, but do not have the time to download and try-out the demo? You can watch a movie of the demo on your computer instead by clicking below.
Grain size analysis tests can include sieve data, washed sieve data, and hydrometer data as specified in ASTM Test Method D-422. There is no limit to the number of samples in a project and the number of tests per sample.
Each grain size analysis chart is composed of three parts; a graph, an optional legend, and a header. The graphical windows interface displays the charts as they are entered and shows how the chart will look when it is printed.
All test results, sample and project information is stored in a Microsoft Access relational database. This database allows for the quick storage and retrieval of sample and test data, and can be interfaced with a variety of other programs. There is no limit to the number of projects, samples, and test results that can be stored in the database. The database is setup to work across a network if desired, with each project stored in a separate directory.
A master project database is maintained by the program to track the status and locations of projects. This database contains the project number, name, and directory location.
Grain size analysis results for up to 5 tests can be plotted on a single graph. In addition, the grain size specifications can also be plotted on the graph. Classification system, fonts, colors, scales, line types, point types, and titles can be easily customized for each graph.
The classification system is plotted beneath each graph to provide easy comparison with sample results. Several standard classification systems are provided including:
The sieve analysis can also have an optional legend block at the top or bottom, which can be used to display sample information, classification results, and grain size analysis results. A header is also displayed at the top or bottom of each graph, which can be used to show a company logo or site map (stored as a bitmap and imported into the program), project name and number, borehole information, sample information, or other text.
代碼
[安全檢測]
Winsieve v1.20 (c) GAEA Technologies
    ▒   Disks: 9 x 5,00mb                             Date : January 31, 2011      ▒
    ░   OS   : Windows                                                            ░
    ▓  Release Description:
    ▒  ~~~~~~~~~~~~~~~~~~~
       WinSieve can be used to enter, edit and print grain size analysis charts
       in several standard or custom formats.
       Grain size analysis tests can include sieve data, washed sieve data, and
       hydrometer data as specified in ASTM Test Method D-422. There is no limit
       to the number of samples in a project and the number of tests per sample.
       Each grain size analysis chart is composed of three parts; a graph, an
       optional legend, and a header. The graphical windows interface displays
       the charts as they are entered and shows how the chart will look when it
       is printed.
       All test results, sample and project information is stored in a Microsoft
       Access relational database. This database allows for the quick storage
       and retrieval of sample and test data, and can be interfaced with a
       variety of other programs. There is no limit to the number of projects,
       samples, and test results that can be stored in the database. The database
       is setup to work across a network if desired, with each project stored in
       a separate directory.
       A master project database is maintained by the program to track the status
       and locations of projects. This database contains the project number, name,
       and directory location.
       Grain size analysis results for up to 5 tests can be plotted on a single
       graph. In addition, the grain size specifications can also be plotted on
       the graph. Classification system, fonts, colors, scales, line types, point
       types, and titles can be easily customized for each graph.
    ▀▄▀▀
    █▀ Installation:
    ▓  """""""""""""""
    ▒  Just unpack&install. Unrar crack.rar to installdir.
    ░
    ▀▄▀▀
    █▀ Greetz:
    ▓  """""""""""""""
    ▀▄▀▀
    █▀ Contact Us:
    ▓  """""""""""""""
★未經過安全檢測
[安裝測試]
★未經過安裝測試,使用者後果自負與本論壇無關。
- 上一頁:《醫學統計軟件》(MedCalc)v11.5.0.0/含注冊機[壓縮包]
- 下一頁:《空間數據解決方案》(Safe Software FME Desktop)v2011.6501/x86+x64/含破解文件[壓縮包]
相關資源:


- [編程開發]JavaEE基礎就業班第34期(廣州培訓基地)
- [多媒體類]《藍光DVD視頻轉換軟件》(Odin Blu-ray DVD Ripper Platinum)v8.8.8[壓縮包]
- [操作系統]《IBM AIX 5L 原廠打包Linux工具箱 (2008.09.30)》(IBM AIX 5L Toolbox for Linux (2008.09.30))[光盤鏡像],操作系統、資源下載
- [編程開發]《中望CAD 2009i / 2008i / 2007 / 2006i 簡體中文專業版 之 永不重裝版 全套收錄》(ZWCAD Cloud Edition Complete Collection)[雲端資源包],行業軟件、資源下載
- [行業軟件]《動態幾何畫板軟件》(Key Curriculum Press The Geometers Sketchpad )v5.05[壓縮包]
- [系統工具]《驅動檢查》(Driver Checker 2.7.4 Datecode/含序列號)V2.7.4[壓縮包]
- [軟件綜合]《晝夜采集助手V2.00 正式版》 批量采集優酷 土豆 qq播客工具
- [網絡軟件]如來神掌:宇宙爭雄 Buddhas Palm
- [網絡軟件]《Google 自動翻譯工具專業版》(Google Translate Client Pro)v5.1.551 英文[壓縮包]
- [多媒體類]《ImTOO手機鈴聲制作軟件(支持輸出M4R、M4A、AMR格式)》(ImTOO Ringtone Maker) v2.0.1.0401 多國語言版[安裝包]
- [其他圖書]《雲中孤雁最新E書精選》雲中孤雁E書典藏版(
- [電腦基礎]《Photoshop CS3 通道與蒙版基礎教程》(Lynda.com Photoshop CS3 Channels and Masks The Essentials)[ISO]
- [電腦基礎]《Core Java基礎教程》(Core Java Base Course)[DVDRip]
- [應用軟件]《晴窗中文大俠5.0鑽石版》帶WinXP SP2升級包
- [學習課件]《怎樣學叢書:怎樣學語文》文字版,全4冊[PDF]資料下載
- [行業軟件]《3D CAD 設計工程軟件》(SolidWorks v2010 SP1.0 Update Only Win32/64)[光盤鏡像]
- [計算機與網絡]《Ruby Programming——向Ruby之父學程序設計(第2版)》掃描版[PDF]
- [學習課件]《中國古建築文化之旅-山東》(張潤武&張濰)圖文版[PDF] 資料下載
- [人文社科]《中國歷史寶庫》(柴劍虹)掃描版[PDF]
- [英語學習資料]Joseph LoDuca -《圖書館員》(The Librarian (US))Original Soundtrack From The Television Series[MP3] 資料下載
- 《打印放大工具》(Genuine Fractals v6.0 Professional Edition )[壓縮包],行業軟件、資源下載
- 《高級設計系統ADS2003C》(Advanced Design System 2003C)2003C[ISO]
- 《財務預算軟件》(PerpetualBudget System)v6.0.79[壓縮包]
- 《NI.LabVIEW.v8.0.FPGA.Module. 控制》
- 《ArchiCAD 10 真正建築軟件》(ArchiCAD 10)英文[Bin]
- 《高級有限元仿真》(ANSYS Products v12.1 Win32/64)[光盤鏡像]
- 《預約資訊管理》(OrgBusiness Cozy Restaurant Reservation)v3.9[壓縮包]
- 《建築三維模擬設計軟件》(Pixelplan Flow Architect Studio 3D)v1.5.5.Bilingual<持續更新>[壓縮包]
- 《Act Premium 2008 v10.0.1.199》,行業軟件、資源下載
- 《ANSYS10.0有限元分析軟件》10[ISO],行業軟件、資源下載
- 《中望CAD 2009專業版》(ZwCAD 2009 Professional v2009.02.27.9377)[光盤鏡像],行業軟件、資源下載
- 《聲音和振動軟件》(Sound and Vibration Measurement Suite v7.0)[光盤鏡像]
免責聲明:本網站內容收集於互聯網,本站不承擔任何由於內容的合法性及健康性所引起的爭議和法律責任。如果侵犯了你的權益,請通知我們,我們會及時刪除相關內容,謝謝合作! 聯系信箱:[email protected]
Copyright © 電驢下載基地 All Rights Reserved