《3D圖像編輯軟件》(Kylebank Graphis v2.9.33)[壓縮包],行業軟件、資源下載 簡介: 中文名: 3D圖像編輯軟件英文名: Kylebank Graphis v2.9.33資源格式: 壓縮包發行時間: 2009年地區: 美國語言: 英文簡介: 官方網站 http://www.kylebank.com/ 使用下載 http://www.kylebank.com/Downloads/Graphis2933Setup.exe Graphis是一個3D圖像編輯軟體, 它最大的功
"《3D圖像編輯軟件》(Kylebank Graphis v2.9.33)[壓縮包],行業軟件、資源下載"介紹
中文名: 3D圖像編輯軟件英文名: Kylebank Graphis v2.9.33資源格式: 壓縮包發行時間: 2009年地區: 美國語言: 英文簡介:
官方網站 http://www.kylebank.com/
使用下載 http://www.kylebank.com/Downloads/Graphis2933Setup.exe
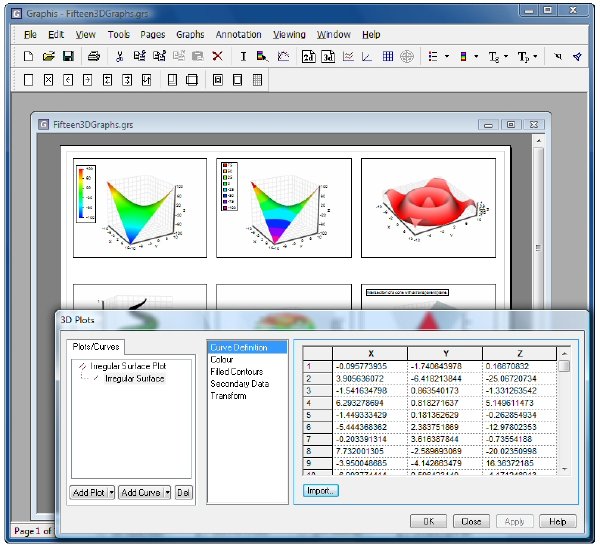
Graphis是一個3D圖像編輯軟體, 它最大的功能是可以把每個項目以表格形式平鋪顯示,每個項目都有一個曲線圖表的預覽圖。還能對圖像進行圖表分析來繪制它的數學表達式。
引用Graphis graphing software is a powerful scientific/engineering data visualization and analysis tool. At the core of its functionality is the ability to create both tabular and analytical curves. Tabular curves can be used to plot data held in tabular form, while analytical curves can be used to plot mathematical expressions.
Tabular curves are created in Graphis by entering data manually into a curve's table, by pasting it from another application such as Excel, or by importing it from data previously imported into a Graphis Spreadsheet. Graphis spreadsheets allow data to be imported from character-delimited text files using an Excel-like data import feature.
Graphis 2D and 3D visualization software makes the generation of analytical curves effortless. For example, to plot sin(x), simply enter y = sin(x) in the curve definition window. The curve definition need not be a single line. It can consist of multiple lines consisting of constants, variables and expressions defining components of an overall formula.
In addition to 2D (1 independent variable) data plotting, Graphis provides a sophisticated set of 3D (2 independent variables) plot types which can also be used individually or combined to construct a wide range of graphs. These can range from standard surface plotting to complex 3D visualizations comprising analytical expressions, tabular data, 3D objects, annotation, and image overlay.
Data analysis capabilities are also provided in the form of statistical functions and standard statistical analysis plots such as histograms, box plots, probability plots and curve fitting. The program also features a general multidimensional nonlinear regression tool.
Graphis 2D and 3D plotting software can also be driven remotely from another program via COM automation. Controlling Graphis from a programming language provides a wide range of possibilities, from writing code which interactively controls Graphis via your own dialogs, to creating movies utilising any combination of Graphis features you wish. Click here to download some example movies.
Built around this core functionality is an extensive range of features to allow you to create presentation-quality graphs with the minimum of effort. See here for an overview of how Graphis data visualization software is used, and here for a more detailed list of features available in Graphis.
nfo:
代碼 Graphis v2.9.33 c Kylebank
² ִִִִִִִִִִִִִִִִִִִִִִִִִִִִִִִִִִִִִִִִִִִִִִִִִִִִִִִִִִִִִִִִִִִִִִִִִִִ ²
± Disks 7 x 5,00mb Date March 20, 2009 ±
° OS Windows °
² Release Description
± ~~~~~~~~~~~~~~~~~~~
Graphis graphing software is a powerful scientific/engineering data
visualization and analysis tool. At the core of its functionality is the
ability to create both tabular and analytical curves. Tabular curves can
be used to plot data held in tabular form, while analytical curves can be
used to plot mathematical expressions.
Tabular curves are created in Graphis by entering data manually into a
curve's table, by pasting it from another application such as Excel, or by
importing it from data previously imported into a Graphis Spreadsheet.
Graphis spreadsheets allow data to be imported from character-delimited
text files using an Excel-like data import feature.
°
Installation
²
± Just unpack install. Use included keygen to make valid serial.
官方網站 http://www.kylebank.com/
使用下載 http://www.kylebank.com/Downloads/Graphis2933Setup.exe
Graphis是一個3D圖像編輯軟體, 它最大的功能是可以把每個項目以表格形式平鋪顯示,每個項目都有一個曲線圖表的預覽圖。還能對圖像進行圖表分析來繪制它的數學表達式。
引用Graphis graphing software is a powerful scientific/engineering data visualization and analysis tool. At the core of its functionality is the ability to create both tabular and analytical curves. Tabular curves can be used to plot data held in tabular form, while analytical curves can be used to plot mathematical expressions.
Tabular curves are created in Graphis by entering data manually into a curve's table, by pasting it from another application such as Excel, or by importing it from data previously imported into a Graphis Spreadsheet. Graphis spreadsheets allow data to be imported from character-delimited text files using an Excel-like data import feature.
Graphis 2D and 3D visualization software makes the generation of analytical curves effortless. For example, to plot sin(x), simply enter y = sin(x) in the curve definition window. The curve definition need not be a single line. It can consist of multiple lines consisting of constants, variables and expressions defining components of an overall formula.
In addition to 2D (1 independent variable) data plotting, Graphis provides a sophisticated set of 3D (2 independent variables) plot types which can also be used individually or combined to construct a wide range of graphs. These can range from standard surface plotting to complex 3D visualizations comprising analytical expressions, tabular data, 3D objects, annotation, and image overlay.
Data analysis capabilities are also provided in the form of statistical functions and standard statistical analysis plots such as histograms, box plots, probability plots and curve fitting. The program also features a general multidimensional nonlinear regression tool.
Graphis 2D and 3D plotting software can also be driven remotely from another program via COM automation. Controlling Graphis from a programming language provides a wide range of possibilities, from writing code which interactively controls Graphis via your own dialogs, to creating movies utilising any combination of Graphis features you wish. Click here to download some example movies.
Built around this core functionality is an extensive range of features to allow you to create presentation-quality graphs with the minimum of effort. See here for an overview of how Graphis data visualization software is used, and here for a more detailed list of features available in Graphis.
nfo:
代碼 Graphis v2.9.33 c Kylebank
² ִִִִִִִִִִִִִִִִִִִִִִִִִִִִִִִִִִִִִִִִִִִִִִִִִִִִִִִִִִִִִִִִִִִִִִִִִִִ ²
± Disks 7 x 5,00mb Date March 20, 2009 ±
° OS Windows °
² Release Description
± ~~~~~~~~~~~~~~~~~~~
Graphis graphing software is a powerful scientific/engineering data
visualization and analysis tool. At the core of its functionality is the
ability to create both tabular and analytical curves. Tabular curves can
be used to plot data held in tabular form, while analytical curves can be
used to plot mathematical expressions.
Tabular curves are created in Graphis by entering data manually into a
curve's table, by pasting it from another application such as Excel, or by
importing it from data previously imported into a Graphis Spreadsheet.
Graphis spreadsheets allow data to be imported from character-delimited
text files using an Excel-like data import feature.
°
Installation
²
± Just unpack install. Use included keygen to make valid serial.
- 上一頁:《Robotics Studio 2008及CCR&DSS組件》(Microsoft Robotics Developer Studio 2008 Standard Edition)[光盤鏡像],行業軟件、資源下載
- 下一頁:《地球物理勘探軟件》(Hampson
相關資源:


- [網絡軟件]《HTTP/HTTPS分析軟件》(HTTP Analyzer Full Edition)v5.11 內含注冊機版[壓縮包]
- [行業軟件]CAD版本轉換器【Acme CAD Converter 2014】v8.6.2.1418綠色中文版
- [應用軟件]《11.17 裝機軟件工具盤》[ISO]
- [行業軟件]《達索solidworks2013 x32 x64》(solidworks2013 x32 x64)新版本[壓縮包]
- [系統工具]《Uniblue 頂級系統優化加速軟件》(Uniblue PowerSuite 2010)2010 v2.1.9.8[壓縮包]
- [網絡軟件]《羅馬:全面戰爭》(Rome.Total.War)繁體中文V1.5硬盤版 免費下載
- [行業軟件]《CAXA全系列軟件》CAXA EB 2011 R3 最新加入
- [行業軟件]《AKTA重做系統》(AKTA Unicorn 5.11)5.11[壓縮包],行業軟件、資源下載
- [軟件綜合]《PHP Designer 集成開發環境》 v7.2.0.33 多國語言版 [安裝包]
- [應用軟件]《打譜軟件Sibelius&漢化程序》(Sibelius3.0.9)附帶keygen版本,應用軟件、資源下載
- [生活圖書]《釣魚妙法360例》掃描版[PDF]
- [網絡軟件]《網站推薦工具軟件》(Internet Business Promoter)v12.0.2[壓縮包]
- [計算機與網絡]windows server 2003網絡基本架構的實現和管理
- [編程開發]《PHP 開發智能 IDE》(JetBrains PhpStorm)v5.0.4[壓縮包]
- [人文社科]《傾聽老捨:又是一年芳草綠》原文高清朗讀[光盤鏡像]
- [生活圖書]《手法自療養生大全》掃描版[PDF]
- [人文社科]《書畫趣謎》(丁遠松)掃描版[PDF]
- [教育綜合]2014注冊稅務師-財務與會計-東奧---課件-課後試題+VIP單位測驗 試卷
- [計算機與網絡]《輕松學編程:輕松學Oracle數據庫》掃描版[PDF]
- [計算機與網絡]《Visio 2010圖形設計標准教程》掃描版[PDF]
- 《高級有限元仿真》(ANSYS Products v11 SP1 Linux)[ISO]
- 《單核驗證引擎》(Mentor Graphics QuestaSim 6.2b)
- 《鋼結構分析鍛件設計軟件》(CSC.TEDDS.V8.0)[Bin]
- 《數字波形制作和編輯工具》(Waveform Editor)v2.0[ISO]
- 《NavisWorks計算機輔助設計》(NavisWorks JetStream)v5.2.3[Bin]
- 《Autodesk Inventor Professional 11 英文版》(Autodesk Inventor Professional 11)11[ISO],行業軟件、資源下載
- 《歐特克三維機械設計軟件》(Autodesk Inventor Pro v2011)Win32[光盤鏡像]
- 《記單詞軟件下載語言島智能記單詞》(liword for veket)3.4.554[安裝包]
- 《有限元分析》(FEA v23 SP2 x32/x64)[光盤鏡像]
- 《流程圖制作軟件》(Corel iGrafx Enterprise)v15.0.0.1538 Multilingual[壓縮包]
- 《Mastercam.X4.樣例包》(Mastercam.X4.Sample.Files)v1.0.0-NoPE[壓縮包]
- 《CAD/CAM系統》(MASTERCAM FOR SOLIDWORKS)X4含破解/更新至X5[光盤鏡像]
免責聲明:本網站內容收集於互聯網,本站不承擔任何由於內容的合法性及健康性所引起的爭議和法律責任。如果侵犯了你的權益,請通知我們,我們會及時刪除相關內容,謝謝合作! 聯系信箱:[email protected]
Copyright © 電驢下載基地 All Rights Reserved